Generator icons for geo-data MIG
Welcome jarosovaite. I want to share with you one of my recent mini-projects — generator icons using GEODATA MIG. It can be used to generate a vector (SVG) and raster (PNG) icons with specified parameters (color, size, stroke, etc.).
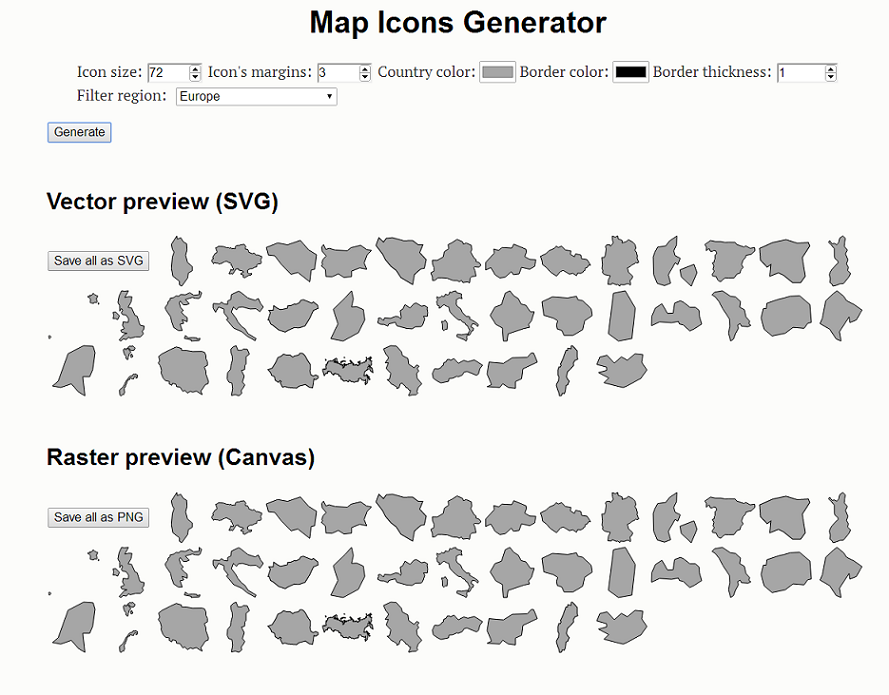
It works directly in the browser and is licensed under the MIT. Under the cut, you can learn how to use it and how it works.
By default, MIG for generation of icons uses the world map in the scale of 1:110m, based on GEODATA natural earth data. It contains data for the (174+3) of the world (the others at this scale, degenerate), plus three countries — this is Northern Cyprus, Kosovo and Somaliland. If you do this enough, then just set the settings you want icons directly in the code, or use GUI at dimostranze MIG'. If you want to filter a portion of this can be easily done by setting the conditions for existing properties (
the
The demo looks very austere, because to achieve interesting results still need to change code. So feel free to forcite MIG and change it for themselves. Yes, the demo uses the new input's s (HTML5), they are still not everywhere supported: caniuse, but there is a fallback, so working out in any case, it should.
So, what to do if the default does not suit you. The first thing you need to define new data — it can be a world map, country map with administrative borders, the map of the city divided into districts or any other card. Once you've decided on your data, you must convert them to TopoJSON. This can be done using Command-line TopoJSON after setting implementation of TopoJSON for Node.js. At the stage of conversion, you must remove all unnecessary properties, you can also add names if you are going to use for this external file. When a new TopoJSON file is ready, update the path and name
the
Change the name of the
the
It is now possible to generate icons!
For those occasions when you need to use the standard Mercator projection, you can easily add one of projections available or even create your own. It is possible to apply separate projection for at least each icon. By the way, in the demo example, there are separate projections for Russia and the United States.
the
In General, there is a vast field for experimentation.
Generator is written using the library D3.js, the code can be viewed on GitHub: Map Icons Generator. So, what's going on. First load GEODATA and corresponding names (when they are not sewn into the TopoJSON file). Then, for each object is created SVG element of a given size and renders the appropriate region of the map in a given projection, the alignment and scale are calculated based on
Next, based on the created vector icons, create raster. This happens in the following way: in a loop iterate through every SVG elements, create canvas elements and draw back our icon using the
Thinking of adding a filter on countries and to improve the design of dimostranze. To change the persistence mechanism — now the icons are stored either individually by clicking on the country or the entire region(continent), while on each icon creates a modal window, plan to replace it on the option to download the icons in one archive. Also plan to add the ability to simplify the geometry and precision for your data, so you can adjust them accordingly to the size of the icons. Now it can be done at the stage of creating TopoJSON (
If you have any questions, do not understand something, found a bug or something — write.
That's all, good luck!
Article based on information from habrahabr.ru
It works directly in the browser and is licensed under the MIT. Under the cut, you can learn how to use it and how it works.
How to use
By default, MIG for generation of icons uses the world map in the scale of 1:110m, based on GEODATA natural earth data. It contains data for the (174+3) of the world (the others at this scale, degenerate), plus three countries — this is Northern Cyprus, Kosovo and Somaliland. If you do this enough, then just set the settings you want icons directly in the code, or use GUI at dimostranze MIG'. If you want to filter a portion of this can be easily done by setting the conditions for existing properties (
properties). For example here is filtering aydishnik:the
.data(topojson.feature(world, world.objects.countries).features
.filter(function(d) {return contryList.indexOf(d.id) > -1;}))
The demo looks very austere, because to achieve interesting results still need to change code. So feel free to forcite MIG and change it for themselves. Yes, the demo uses the new input's s (HTML5), they are still not everywhere supported: caniuse, but there is a fallback, so working out in any case, it should.
So, what to do if the default does not suit you. The first thing you need to define new data — it can be a world map, country map with administrative borders, the map of the city divided into districts or any other card. Once you've decided on your data, you must convert them to TopoJSON. This can be done using Command-line TopoJSON after setting implementation of TopoJSON for Node.js. At the stage of conversion, you must remove all unnecessary properties, you can also add names if you are going to use for this external file. When a new TopoJSON file is ready, update the path and name
the
.defer(d3.json, "data/TopoJSON_file.json")
.defer(d3.tsv, "data/external_file_for_names.tsv")
Change the name of the
feature to match your new file:the
.data(topojson.feature(world, world.objects.YourNewFeatureName).features
It is now possible to generate icons!
Additional features
For those occasions when you need to use the standard Mercator projection, you can easily add one of projections available or even create your own. It is possible to apply separate projection for at least each icon. By the way, in the demo example, there are separate projections for Russia and the United States.
the
switch (d.id) {
//Russia
case "RUS": var projection = d3.geo.albers().rotate([-105, 0]).center([-10, 65]).parallels([52, 64]);
path = d3.geo.path().projection(projection);
break;
//USA
case "USA": var projection = d3.geo.albersUsa();
path = d3.geo.path().projection(projection);
break;
default: var projection = d3.geo.mercator();
path = d3.geo.path().projection(projection);
break;
}
In General, there is a vast field for experimentation.
under the hood
Generator is written using the library D3.js, the code can be viewed on GitHub: Map Icons Generator. So, what's going on. First load GEODATA and corresponding names (when they are not sewn into the TopoJSON file). Then, for each object is created SVG element of a given size and renders the appropriate region of the map in a given projection, the alignment and scale are calculated based on
BoundingBox. Connected with this matter a few nuances, as the representation of GEODATA depends on the projection, in some cases, Autocentrum and auto-scaling will give an ugly result. For example, countries through which antimeridian (including our long-suffering Russia) or countries with a large spread of territories (island) will look very small. This can be corrected with an appropriate projection, or removal (filtration) of the territories of the display region. Then move on to styling the icons. At this point, you can use a different SVG filters, gradients, patterns, clipping — in General, the full power of SVG.Next, based on the created vector icons, create raster. This happens in the following way: in a loop iterate through every SVG elements, create canvas elements and draw back our icon using the
context.drawImage(), there is a small caveat, the SVG should be all right with the xmlns attribute and its Blob'is correct a MIME type, otherwise it will never work. Now tie save, run and enjoy the resulting icons.Further development
Thinking of adding a filter on countries and to improve the design of dimostranze. To change the persistence mechanism — now the icons are stored either individually by clicking on the country or the entire region(continent), while on each icon creates a modal window, plan to replace it on the option to download the icons in one archive. Also plan to add the ability to simplify the geometry and precision for your data, so you can adjust them accordingly to the size of the icons. Now it can be done at the stage of creating TopoJSON (
simplification and quantization).If you have any questions, do not understand something, found a bug or something — write.
That's all, good luck!


Comments
Post a Comment