How to get to the top on Kaggle, or Matriksnet at home
Want to share the experience of participation in competition Kaggle and machine learning algorithms, which got the 18-th place from 1604 to the Avazu competition prediction CTR (click-through rate) of mobile advertising. In the process, tried to recreate the original algorithm Matrixnet, tested some options logistic regression and worked with characteristics. All this below plus put the complete code so you can see how it works.
The story is divided into the following sections:
1. Conditions of the competition;
2. The creation of new features;
3. Logistic regression charms adaptive gradient;
4. Matriksnet – reconstruction of the full algorithm;
5. Accelerating machine learning in Python.
Given data:
the
The data itself can be downloaded here.
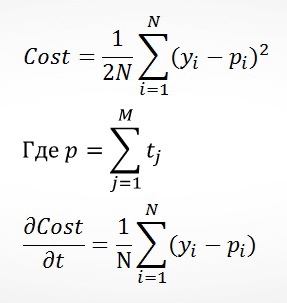
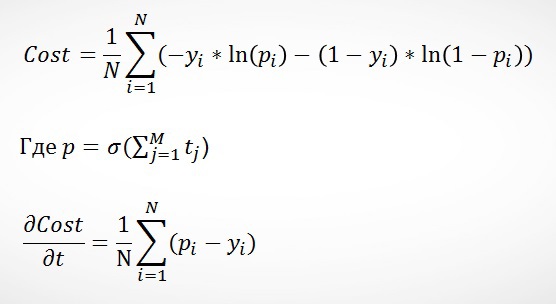
As the criterion was declared negative error probability (Negative Likelihood Loss – NLL):

Where N is the number of records, y is the value of a variable, click p – the likelihood that the event was a click ("1").
An important property of this error function is that if p based on the sigmoid function, then the partial derivative (the gradient) is (p-y).

For a start look at the raw data with which we can work:
the
This is not a very large field for work, since we have no historical data on the users, and most importantly — we know nothing about that ad is shown every time. And this is the important part (you did not click on all ads in a row?).
Create a new:
Ideas tried above gave the best score. Their formation was mainly based on his experience in advertising and that it was possible to pull out of Avazu data.
Also do a little conversion/data transformation, aimed primarily at getting rid of duplicate information:
the
All changes were tested using logistic regression: they are either allowed to improve or accelerate the algorithm and does not impair the results.
Logistic regression is a popular algorithm for classification. There are 2 main reasons for this popularity:
1. Easy to understand and create an algorithm;
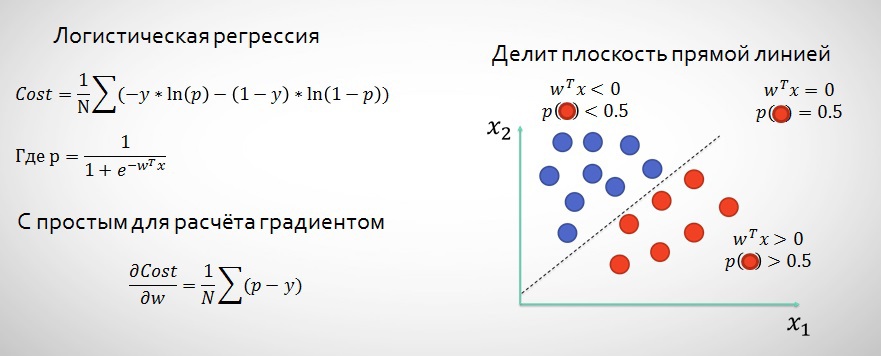
2. Speed and agility predictions for big data through stochastic gradient descent (stochastoc gradient descent, SGD).

For example, data Avazu view, both because of stochastic gradient we don't always "go" just to the minimum of:
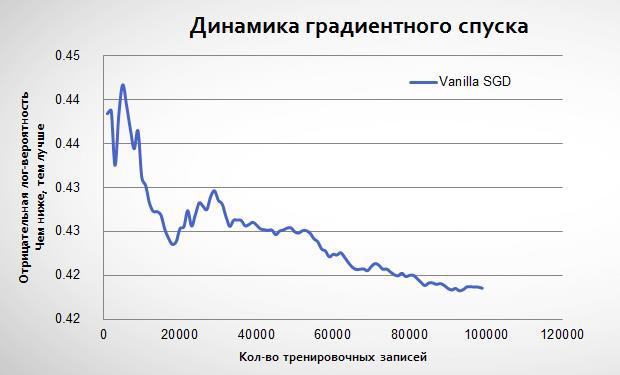
However, if over time, reduce the learning rate of the algorithm (learning rate), we will all come to a more accurate solution, since the gradient is not so much to respond to atypical data. The authors of the adaptive gradient (Adaptive Gradient, AdaGrad) propose to use the sum of all previous gradients to consistently reduce the speed of learning:
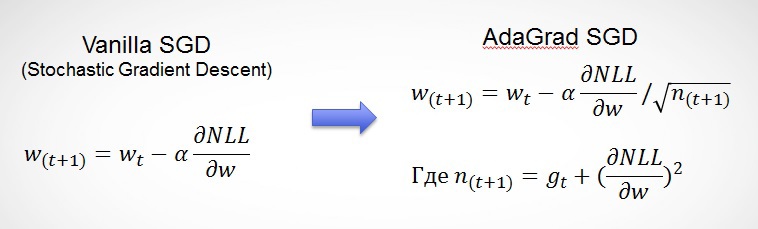
Thus, we obtain useful properties of the algorithm:
the
Adaptive gradient begins to learn the same way as regular logistic regression, but then comes to a lower minimum:
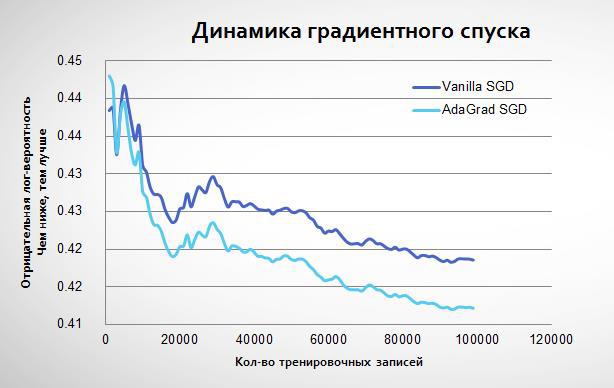
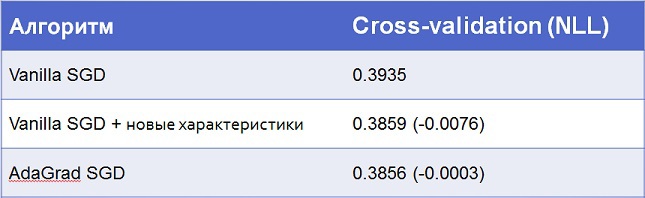
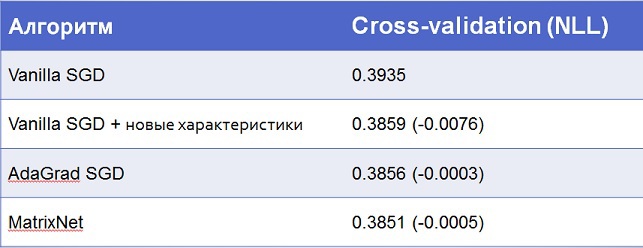
In fact, if the usual stochastic gradient descent to be repeated many times on the same data, it may be close to AdaGrad. However, it will take more iterations. In my model I used a combination of these techniques: 5 iterations with the conventional algorithm, and then one with AdaGrad. Here are the results:
To the logistic regression algorithm can work with data (and they are presented in the format of text values), you need to convert them to scalar values. I used one-hot encoding: text characteristics in a matrix NxM with values "0" and "1", where N is the number of records and M is the number of unique values this characteristics. The main reasons for the preserved maximum information, and feature hashing allows you to quickly work with spaces with millions of characteristics within the framework of logistic regression.
After I got good results with logistic regression, it was necessary to continue to improve. I was interested to understand how it works Matriksnet Yandex moreover, I was expecting a good result (after all, it is one of the tasks is to predict the CTR inside the Yandex advertising for the issue to find). If you collect all publicly available information about Matrixnet (see the full list of links at end of article), you can recreate the algorithm. I do not claim that in this form the algorithm running inside Yandex, I don't know, but in your code and in this article used all found "chips" and hints at them.
Let's go in order of what is Matrixnet:
Article based on information from habrahabr.ru
The story is divided into the following sections:
1. Conditions of the competition;
2. The creation of new features;
3. Logistic regression charms adaptive gradient;
4. Matriksnet – reconstruction of the full algorithm;
5. Accelerating machine learning in Python.
1. Competition terms
Given data:
the
-
the
- 40.4 million records for training (10 days of ads Avazu); the
- 4.5 million records to test (1 day).
The data itself can be downloaded here.
As the criterion was declared negative error probability (Negative Likelihood Loss – NLL):
Where N is the number of records, y is the value of a variable, click p – the likelihood that the event was a click ("1").
An important property of this error function is that if p based on the sigmoid function, then the partial derivative (the gradient) is (p-y).
2. Creating new features
For a start look at the raw data with which we can work:
the
-
the
- сlick – "0" – not clicks "1" – was click, it's the target of prediction; the
- hour – the date and time of ad display; the
- banner_pos is the location of the banner (presumably the first screen, second screen, etc.); the
- site* app* features – information about the place of ad display; the
- device* features – information about the device on which the ad is displayed; the
- C1, C14-C21 — encrypted features (presumably including data on the location of the show, time zone and perhaps other information).
Sample data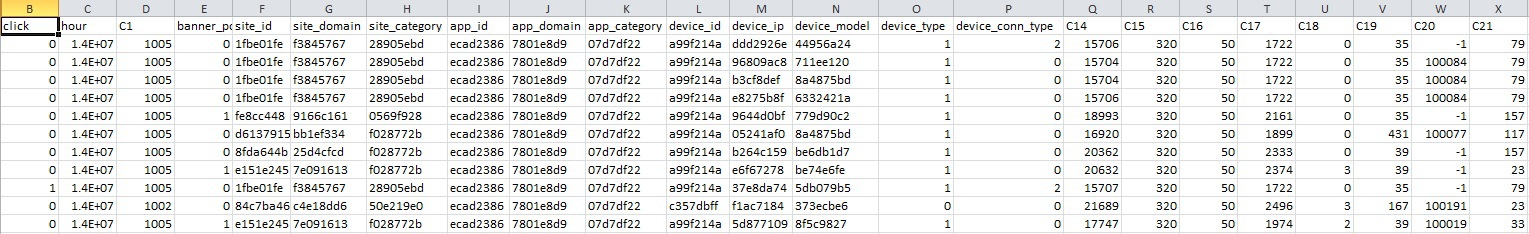
This is not a very large field for work, since we have no historical data on the users, and most importantly — we know nothing about that ad is shown every time. And this is the important part (you did not click on all ads in a row?).
Create a new:
-
the
- of the Polynomial characteristics of the 2nd level (3rd is too slow the learning process); the
- User_id. Tested some options, works best – device_id + device_ip + device_model + C14 (presumably geography at the city level / region). And Yes, device_id is not equal to user_id; the
- Frequency of contact with advertising. Generally, users who see the ad 100 times per day to react to it is not the same as those who see in the 1st. Therefore, we consider the frequency of each show for each user_id.
Example of a user id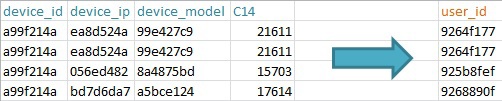
Ideas tried above gave the best score. Their formation was mainly based on his experience in advertising and that it was possible to pull out of Avazu data.
Also do a little conversion/data transformation, aimed primarily at getting rid of duplicate information:
the
-
the
- hour – select the hour, throw away the day; the
- C1 – assuming that was behind time zone, so after 2 numbers merge with column h; the
- C15 and C16 – combine, as they easily guessed the width and height of the banner, it makes no sense to leave extra features; the
- Site* and app* — transform in placement* as it is clear that the banner is displayed, either on the site or in the app, and the other value is simply an encrypted NULL, which additional information shall not be;
All changes were tested using logistic regression: they are either allowed to improve or accelerate the algorithm and does not impair the results.
3. Logistic regression (Logistic Regression) – the charm of adaptive gradient
Logistic regression is a popular algorithm for classification. There are 2 main reasons for this popularity:
1. Easy to understand and create an algorithm;
2. Speed and agility predictions for big data through stochastic gradient descent (stochastoc gradient descent, SGD).
For example, data Avazu view, both because of stochastic gradient we don't always "go" just to the minimum of:
3.1. Adaptive gradient
However, if over time, reduce the learning rate of the algorithm (learning rate), we will all come to a more accurate solution, since the gradient is not so much to respond to atypical data. The authors of the adaptive gradient (Adaptive Gradient, AdaGrad) propose to use the sum of all previous gradients to consistently reduce the speed of learning:
Thus, we obtain useful properties of the algorithm:
the
-
the
- More smooth descent to the minimum (the learning rate decreases with time); the
- alpha for each feature is calculated individually (which is very important for sparse data where most of the characteristics are very rare); the
- In the calculation of alpha is taken into account, how much to change the parameter (w) characteristics: the more varied earlier, the less will change in the future.
Adaptive gradient begins to learn the same way as regular logistic regression, but then comes to a lower minimum:
In fact, if the usual stochastic gradient descent to be repeated many times on the same data, it may be close to AdaGrad. However, it will take more iterations. In my model I used a combination of these techniques: 5 iterations with the conventional algorithm, and then one with AdaGrad. Here are the results:
3.2. Transformation of data for logistic regression
To the logistic regression algorithm can work with data (and they are presented in the format of text values), you need to convert them to scalar values. I used one-hot encoding: text characteristics in a matrix NxM with values "0" and "1", where N is the number of records and M is the number of unique values this characteristics. The main reasons for the preserved maximum information, and feature hashing allows you to quickly work with spaces with millions of characteristics within the framework of logistic regression.
Example one-hot encoding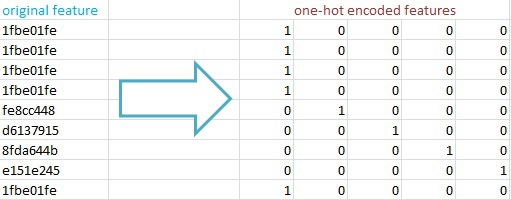
4. Matriksnet – Assembly at home
After I got good results with logistic regression, it was necessary to continue to improve. I was interested to understand how it works Matriksnet Yandex moreover, I was expecting a good result (after all, it is one of the tasks is to predict the CTR inside the Yandex advertising for the issue to find). If you collect all publicly available information about Matrixnet (see the full list of links at end of article), you can recreate the algorithm. I do not claim that in this form the algorithm running inside Yandex, I don't know, but in your code and in this article used all found "chips" and hints at them.
Let's go in order of what is Matrixnet:
-
the
- Basic element – Classification and Regression Tree (CART);
- Update the main algorithm is Stochastic Gradient Boosting Machine (SGBM).
- split into sheets (x_1≥0.5) the
- Height of tree (number of levels with the conditions in the above example of 2) the
- Rule predict p (the example above uses the mathematical expectation)
- PyPy – JIT compiler, which allows you to accelerate the standard CPython x20 times, the main problem is there is virtually no libraries for working with computations (NumPyPy is still in development), all you need to write without them. Perfectly suited for the implementation of logistic regression with stochastic gradient descent, as in our case; the
- Numba decorators jit allow pre-compile some functions (principle, as in PyPy), but the rest of the code can use all the advantages of CPython libraries. A big plus for precompiled functions, you can remove the GIL (Global Interpreter Lock) and use more cpu. What I used for acceleration Matrixnet. Problem Numba is the same as PyPy, — no libraries, the main difference is that Numba is the realization of some of the functions in NumPy.
- Logistic regression, and many more — www.coursera.org/course/ml the
- machine learning Algorithms — seat.massey.ac.nz/personal/s.r.marsland/MLBook.html the
- Adaptive Gradient — www.magicbroom.info/Papers/DuchiHaSi10.pdf the
- Gradient Boosting Machine — statweb.stanford.edu/~jhf/ftp/trebst.pdf the
- Stochastic Gradient Boosting — statweb.stanford.edu/~jhf/ftp/stobst.pdf the
- Matrixnet from Trofimova — wan.poly.edu/KDD2012/forms/workshop/ADKDD12/doc/a3.pdf the
- Matrixnet with ANN based on — arxiv.org/pdf/1412.6601.pdf
the Basic algorithm is Gradient Boosting Machine (GBM) the
4.1. Classification and Regression Tree (CART)
This is one of the classical algorithms decision tree, about which already wrote on Habre (for example, here and here). So I will not go into details, just remind the principle of operation and basic terms.

Thus, a decision tree has the following parameters that define the algorithm:
the
-
the
4.1.1. How to determine the characteristic for the condition of split
At each level, we need to determine the characteristic for the condition of split that will divide the plane in such a way that we will make more accurate predictions.
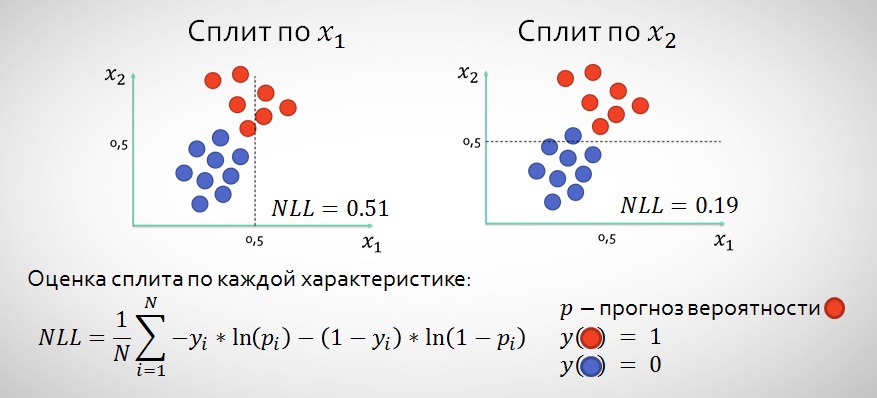
Thus we pass all the characteristics and possible splits and choose those points where we will be below the value of the NLL after the split (in the example above is, of course, x2). To determine the split is usually used by other function, information gain and Gini impurity, but in our case we choose the NLL, as it asked us to minimize the job (see job description in section No. 1).
4.1.2. Regularization in CART
In the case of CART is usually required for regularization, so as not to make too strong predictions of where we really are not sure. Yandex offers to correct the formula predictions as follows:
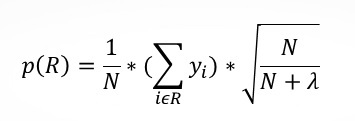
Where N – the number of values in the sheet, and the lambda regularization parameter (experts recommend Matrixnet 100, but you need to test for each task separately). Thus, the less we have of the values in the sheet, the less our algorithm is confident in predicting a value.
4.1.3. Forgetful trees (Oblivious Trees)
In Matrixnet instead of the classical approach, when after a split x1 the next level of the tree may not share data, are used so-called forgetful trees, which can under several levels splitit values for the same characteristic (like "forgetting" that it the split was already done).
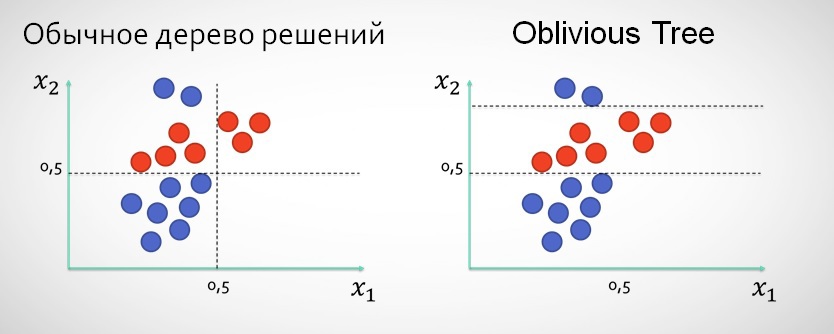
The use of this type of trees, in my opinion, justified especially in cases where there are 1-2 characteristics over narrow splits which give better results than splits on the used features.
4.2. Gradient Boosting Machine
Gradient Boosting Machine (GBM) is the use of a forest of short trees, where each successive tries to guess the target value, and tries to improve the forecast of the previous trees. Consider a simple example with a regression and trees with height 1 (can only do 1 split in each tree).
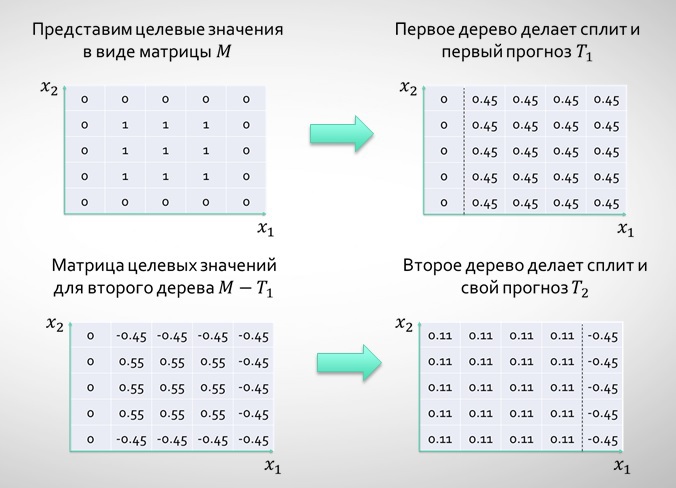
In fact, every tree helps to optimize a quadratic error function:
The main advantage of GBM in comparison with CART is less likelihood of overfitting, as we give predictions based on sheets with more number of values. In Matrixnet in GBM "height" of a tree depends on the current iteration, starting with 1, every 10 iterations increases by 1, but never exceeds 6. This approach allows to significantly accelerate the algorithm, not severely compromising result on the first iterations. I tested this option, but decided to when the transition to the next level takes place after the exhaustion of the possibilities of the previous one.
4.2.1. GBM for classification
When dealing with the classification of each tree should improve the prediction of the previous one, but it should be done so that trees are worked on the same task classification using the sigmoid function. In this case it is convenient to present the optimization problem is the same as in logistic regression, namely:
Interesting solution with Yandex is that as the initial forecast p0 are used for the predictions of logistic regression and the works of scales and characteristics (wTx) — as one of the characteristics.
4.3. Stochastic GBM
Stochastic GBM GBM differs from the usual fact that each tree is a sample of the data (10-50%). At the same time it helps to kill 2 birds with one stone – to improve performance (otherwise we would have to calculate the result for all the training 40.4 million records), and to a large extent to get rid of the problem of overtraining.
The final result:
As you can see, still the biggest optimization gives data, and not themselves algorithms. Although the conventional logistic regression would be difficult to rise above 30 where the account goes on every ten-thousandth.
5. Attempts to accelerate machine learning in Python
It was my first project implementing machine learning algorithms on their own, that is, in code that made predictions, not used ready third-party solutions, all algorithms and data manipulations occur in the open, which allowed me to better understand the objectives and principles of these tools. However, I enjoyed the experience: logistic regression in a significant degree – CAD Abhisheka on Kaggle, Matriksnet borrows a small portion of the CART of the code Stephen Marshall, to the book Machine Learning: Algorithmic Perspective.
From the point of view of realization, I began to experiment with the task in R, but then quickly abandoned it, as it is virtually impossible to work with big data. Python was chosen because of the simplicity of the syntax and the presence of a large number of libraries for machine learning.
The main problem CPython – it is VERY slow (although much faster R). However, there are many options to speed it up, as a result I used the following:
the
-
the
To Cython is not reached, as I tried to accelerate a minimum of blood, but I think next time it is easier to go directly to GPGPU using Theano / Numba.
the Complete code for all of the conversions and by the learning algorithms is here. Disclaimer: the code is not optimized, is intended only for the study of algorithms by themselves.
If you find any inaccuracies or errors in the article or code, in a personal email.
Links to the sources used for the article for the algorithms:
the
-
the


Comments
Post a Comment